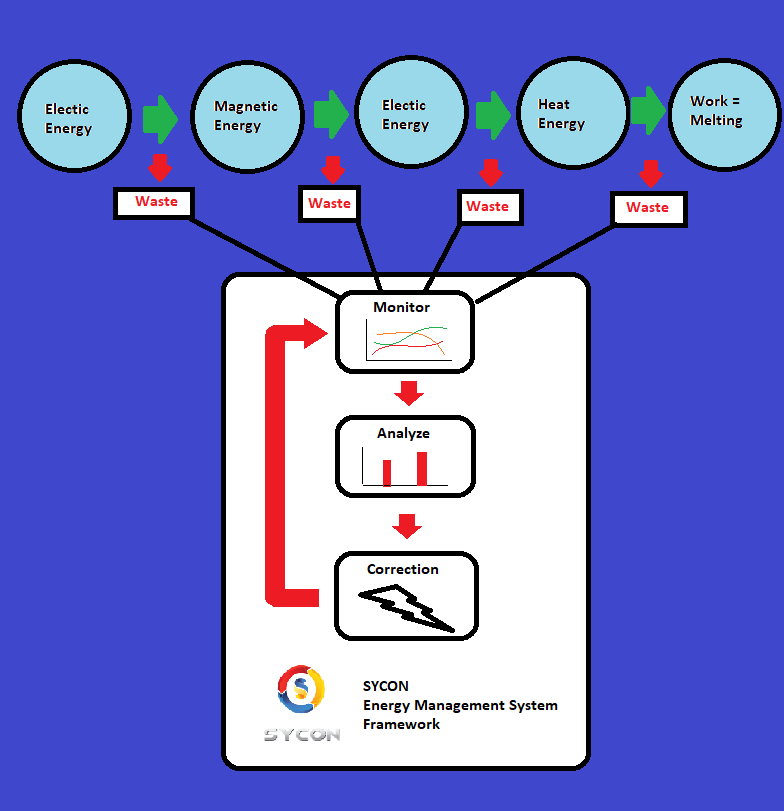
Energy is nothing but the ability to work. Work is done in in many forms – heating, pulling, pushing, driving, placing at some height, charging, melting, blowing, flowing and many more. So to do this work available energy is needed to convert into the the form in which it is suitable to do the work. For example – there is an induction furnace to melt the metal in a foundry – in this case, the electrical energy is converted into heat energy and heat energy does the work of metal melting.
Now the problem lies in this conversion. Whenever one for of energy is converted into another form, not all energy is converted into that form. Some of the energy is wasted in other non-useful work. This is clear waste of energy but sometimes unavoidable. But most of the times, it can be reduced. For that we must have to monitor the conversions those are taking place, the energy being supplied before conversion and the energy after conversion. Once we keep an eye on this, the second task is to analyze the trends in this waste, getting some clues to minimize this waste. Once we get the problem, we can plot fishbone diagram to find out various points of cause. After this we must come to most significant point of cause and we must do a Root Cause Analysis (RCA) of the problem. This will lead us to the root cause of this waste. Now we will have to find out a solution to fix the root cause of the problem. Huh, is it over now? No !, we will have to monitor again and check if that waste is really minimized or eliminated. And if not, we will have to again go to fishbone diagram to find out the next significant point of cause and work out this cycle again.

SYCON Energy Management system
We shall discuss more on Fishbone diagram with case study in our next blog. Stay tuned.


