Being owner of an industrial plant or being a responsible person for electrical energy bills of an industrial plant, do you really check if you are using the best of your contract demand? If the answer is “YES” then “BRAVO”. If the answer is “NO”, then it is time to wake up and know about how you can do this. After reading this today’s Sunday Special Blog, you shall surely be able to understand much more about KVA demand. If you can use it on your side, it is an angel and if you ignore it, it will surely be a demon.
KVA Demand or just Demand
Demand is the power you are drawing at any instant from the electricity utility company. It is called demand because you are demanding that much of power from the utility company. This power demand can be in HP, KW or KVA. But for billing purpose, utility companies generally use apparent power i.e. KVA, so it is KVA demand.
Now when you go for a new connection to utility company, they ask about amount of load in KVA. According to that they grant you electricity for that load. It is contract between you and utility company and you that –
- Utility company shall provide that ‘X’ amount of power to you at any time.
- You shall not draw more than ‘X’ amount of power at any time.
Now this ‘X’ amount is called as “Contract Demand“.
Utility company charges you based on kWh i.e. energy and the KVA demand fetched by you. For the convenience of customers’ use, the utility company meter does not computes this demand with the instantaneous reading of KVA. Instead they take average of the instantaneous demand over a time block. Usually it is of 15 or 30 minutes. Recently some companies have started using 10 minutes block. The maximum of all these block demands or average demands in the month is called as “Maximum Demand” and it is considered for billing. You are charged on the basis of Maximum Demand for that month even though that demand is reached only once to that level. So user must keep an eye on the this average demand in every time block and should restrict to a desired value. If in any block of time, it exceeds the contract demand, you will be charged with a very heavy penalty.
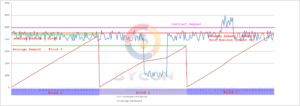
The picture below shows the concept of contract demand, average demand and maximum demand. The pink line is the contract demand sanctioned by utility board. The blue moving line is the instantaneous demand at any instant of the time. Time is plotted on the X-axis with blocks of 30 minutes. Average demand in a block keeps on increasing till the block ends. The slope of this increment depends on the instantaneous demand. If the instantaneous demand is higher, the slope is steeper and if it is lower, the slope is flatter. The green horizontal lines are the levels of average demand of the block. And the red horizontal line indicates the maximum demand till this instance of the time because it is the maximum average demand so far. You can see that the instantaneous demand (running blue) sometimes crosses the contract demand but the maximum demand is still below the contract demand. So in this case no penalty will be applied on the user.

Angel or Demon
If you use your load wisely, you can definitely save the demand charges. You must strive to get maximum of contract demand yet should never exceed it. If you could achieve this, you are optimally using your demand and saving money from this. In this case this demand is used as Angel.But if you are using less than 95% of your contract demand or you are exceeding your contract demand, you are losing your money and demand is acting as a demon for you.
We, at SYCON, assist you to convert the Demon into Angel. We help you to understand your load pattern better. We help you to select correct solution to save the demand charges or penalty if any. We have special products for this application. Please click here to see them, We install these products, commission them and train your employees to use them for the ultimate goal of optimum use of demand. You may drop a mail to us or contact us over phone.
Let us all work on this save energy for our generations to come.
Good Luck !!


